What is Process Memory Map
Process Memory Map builds a detailed memory map of a running process, continuing the idea behind Mark Russinovich's VMMap, but with much deeper analysis:
- displays heaps, thread stacks, TEB/SEH frames, and the call stack
- maps loaded PE images into sections, entry points, and structures
- parses PEB, LOADER_DATA, ACTIVATION_CONTEXT_DATA, KUSER_SHARED_DATA, and many other structures in a human-readable form
- built-in x86/x64 disassembler based on DiStorm
- detects hooks in the import/export tables, delayed imports, andTLS callbacks
- compares the state of memory blocks using checksums — useful, for example, for spotting changes in hacked software
- can search process memory, supports debug information via DWARF 1–3 and MAP files
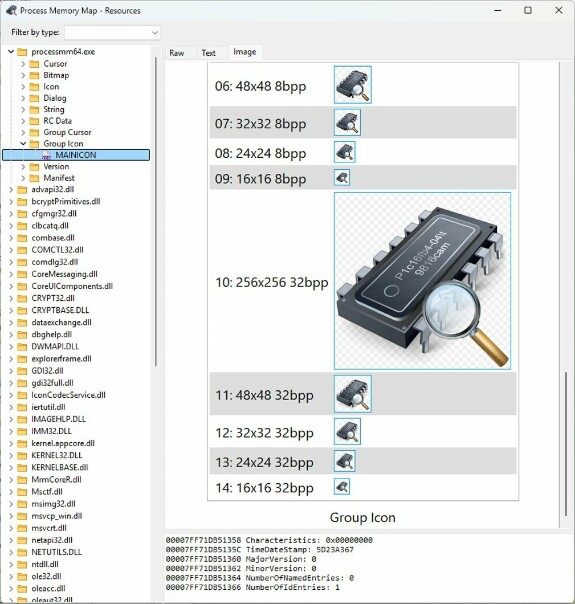
- displays a list of resources used across all process modules
- displays extended information about all windows of a remote process, including OS-level restricted information on window/dialog procedures and instances
Why this is an active project, not an abandoned side project
The latest release is 1.6.52, from July 28, 2026, and updates come out regularly.
Coming soon: support for debug PDB files. Further down the roadmap: full DWARF 4/5 support, moving the disassembler to a new custom-built engine, adding FWHexView as a viewer (already implemented and proven in the CPUView project), and more.
Coming soon: support for debug PDB files. Further down the roadmap: full DWARF 4/5 support, moving the disassembler to a new custom-built engine, adding FWHexView as a viewer (already implemented and proven in the CPUView project), and more.
Source code, documentation, and the full changelog are on GitHub:
https://github.com/AlexanderBagel/ProcessMemoryMap
https://github.com/AlexanderBagel/ProcessMemoryMap