
VSA v09032024 (for TradingView)
* about VSA indicator https://boosty.to/dilbronx/posts/56c110eb-17b5-4903-98e9-be9b724e514a
* VSA indicator (full version) with updates
https://boosty.to/dilbronx/posts/2ec76b11-e0ff-4b4c-8009-d7a8155091ad
(you will receive a link to a private script)
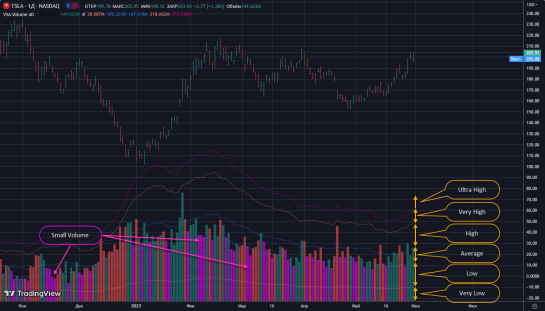
* VSA Volume indicator
https://ru.tradingview.com/script/S1EH5eAU-dil-bronx-vsa-volume/
https://boosty.to/dilbronx/posts/2ec76b11-e0ff-4b4c-8009-d7a8155091ad
(you will receive a link to a private script)
* VSA Volume indicator
https://ru.tradingview.com/script/S1EH5eAU-dil-bronx-vsa-volume/
* VSA lite indicator (demo version, limited functionality)
https://ru.tradingview.com/script/L5qPFyvR-vsa-demo
https://ru.tradingview.com/script/L5qPFyvR-vsa-demo
---
RELEASE NOTES:
VSA v09032024
09 March 2024
EN:
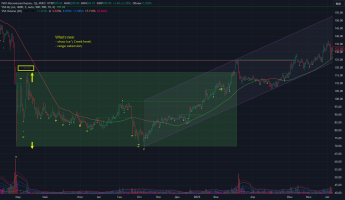
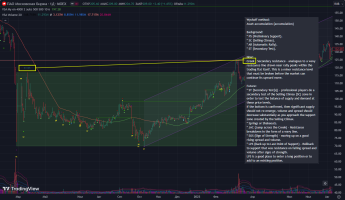
What’s new:
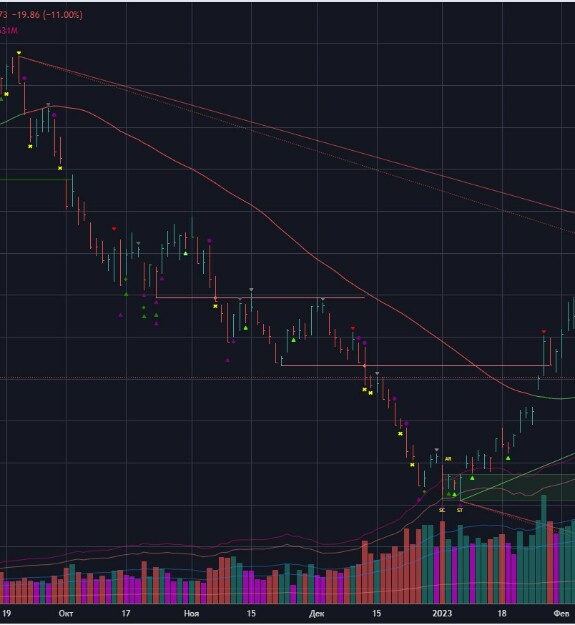
* Downward expansion of the Accumulation range if ST or SP falls below the support line
* Upward expansion of the Accumulation range, if the price rises above the resistance line - a secondary resistance level is formed (Creek level)
* Upward expansion of the Distribution range if ST or UT rises above the resistance line
* Downward expansion of the Distribution range, if the price falls below the support line - a secondary support level is formed (Ice level)
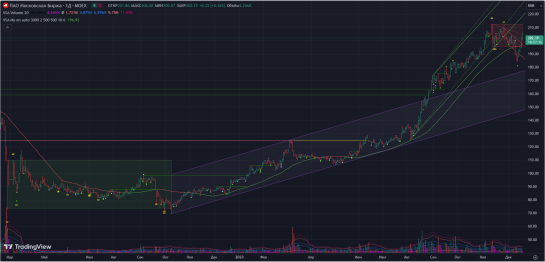
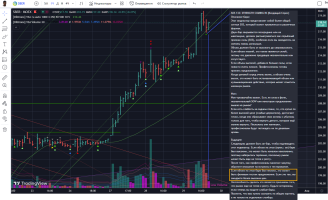
Что можно ожидать:
- завтра день вверх, поглощая [сегодняшние, уровень ~200 руб.] продажи. И далее вверх на перехай.
- или пара тройка дней медленного движения вниз на снижении объемов и формировании NoSupply. И все туда же вверх на перехай.