creator cover Dil Bronx
Dil Bronx

Dil Bronx 

Анализ рынков методом Volume Spread Analysis

7subscribers

28posts

Showcase

3

About

Дил Бронкс.
Практикую анализ финансовых рынков методом VSA (Volume Spread Analysis).
--

VSA (for TradingView)

"VSA" indicator for TradingView
EN:
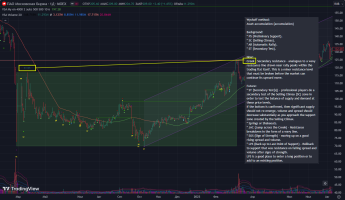
"VSA" indicator - shows analysis according to Volume Spread Analysis (VSA).
To use the indicator effectively, a trader needs to be familiar with the Volume Spread Analysis (VSA) methodology.

Together with the VSA indicator, the VSA Volume indicator helps to determine the interaction between supply and demand as well as assisting traders in their trading decisions.
In the VSA methodology all analysis is based on Relative Volume.
This means that the exact values of the volume on the price bars are not nearly as important as their volume in relation to the previous volume bars.
The source code of the indicator is completely original and written by me.
The idea was taken after studying:
* the book by Tom Williams "Masters of the Markets"
* the book by Gavin Holmes "Trading In The Shadow of the Smart Money"
* Richard Wyckoff method
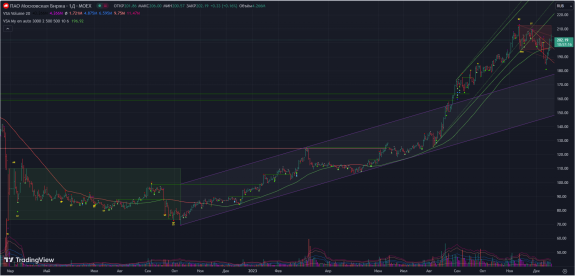
Users can easily see how any volume bar is classified by observing which color band in the volume indicator is reached by the top of any given volume bar.
Price bars where the volume is Ultra High very often begin the VSA Setup, while price bars on Low or Very Low Volume can be the confirmation and end the VSA Setup.
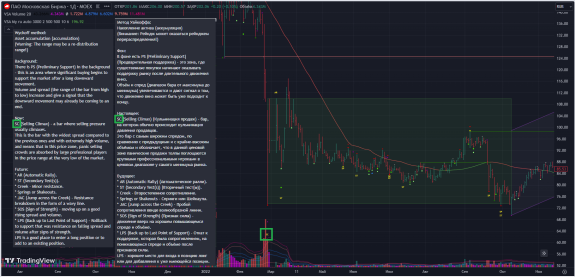
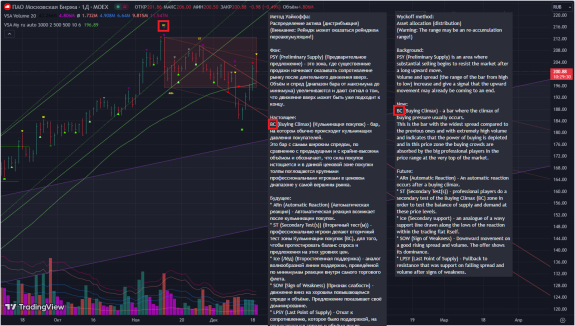
Additionally, the indicator offers:
* detailed description (tooltip) of displayed signals
* Richard Wyckoff analysis
* other experimental analysis
* recommendations for entering trades
The indicator will develop, I have many plans to make it even smarter.
Script updates will be published only for the full version of the indicator. 
---
RU:
New in v09032024:

VSA v08112025 (for TradingView)

VSA indicator (full version) (private version) with updates https://boosty.to/dilbronx/posts/2ec76b11-e0ff-4b4c-8009-d7a8155091ad
(you will receive a link to a private script)
VSA Volume indicator (free)
https://ru.tradingview.com/script/S1EH5eAU-dil-bronx-vsa-volume/
* about VSA indicator
https://boosty.to/dilbronx/posts/56c110eb-17b5-4903-98e9-be9b724e514a
---
RELEASE NOTES:
VSA v08.11.2025
EN:
What’s new:
* You can now disable the display of VSA analysis.
* You can now disable the display of SMA (Simple Moving Average).
* New built-in indicator "Strength and Weakness of a Security."
An indicator of the strength or weakness of an asset based on the Comparative Relative Strength (RSC) indicator.
RSC is an indicator that correlates the price change of one asset with the price change of another, the underlying security.
RSC is calculated by dividing the price of a security (the numerator) by the price of the underlying security (the denominator).
When RSC values rise, the security outperforms the underlying security, and a green line is drawn.
Подробнее о встроенном индикаторе "Сила и Слабость Актива" - в статье по ссылке 

Сила и Слабость Актива

    Том Вильямс в своей книге "Хозяева Рынков" дал определения "Слабые Акции" и "Сильные Акции".
    "Слабые акции" определяются как акции, которые падают быстрее при откате Индекса и не идут вверх, когда Индекс растет. Слабые акции редко демонстрируют силу, когда родительский Индекс начинает движение вверх.
    Акции, которые не падают при падении Индекса, относятся к "Сильным акциям".
    Эти принципы можно использовать при отборе акций для вашего портфеля.
    В новой версии индикатора VSA появится возможность оценить ценную бумагу, Сильнее она или Слабее Индекса.
    Новый встроенный индикатор "Strenght and Weakness of a Security" - 
индикатор Силы и Слабости актива.
Когда ценная бумага превосходит базовый актив - рисуется Зелёная линия.
Когда базовый актив превосходит ценную бумагу - рисуется Красная линия.
Экстремумы ломаной Красно-Зелёной линии соответствуют экстремумам базового актива, с которым происходит сравнение.
Ценная бумага Превосходит Базовый актив - в данном контексте не обязательно означает, что цена растет относительно базового актива, она может также и падать.
    Базовый актив, с которым происходит сравнение, указывается в окне настроек индикатора. В качестве базового актива возможно указать как индекс, так и любую другую ценную бумагу, доступную в TradingView.

    Рассмотрим работу индикатора на примере:

VSA v07072025 (for TradingView)

VSA indicator (full version) (private version) with updates 
https://boosty.to/dilbronx/posts/2ec76b11-e0ff-4b4c-8009-d7a8155091ad
(you will receive a link to a private script)
VSA Volume indicator (free)
https://ru.tradingview.com/script/S1EH5eAU-dil-bronx-vsa-volume/
* about VSA indicator
https://boosty.to/dilbronx/posts/56c110eb-17b5-4903-98e9-be9b724e514a
---
RELEASE NOTES:
VSA v07.07.2025
EN:
Improvements:
* Improvements in the accuracy of trend channel construction.
* Improvements in the accuracy of the "Springboard" signal detection.
* Improvements in the accuracy of Long Setups detection, reducing the probability of a false signal.
* Improvements to the "Springboard" signal. The signal is calculated only for the D1 and W1 timeframes. Previously, on intraday timeframes, the signal appeared quite often and falsely.
* Improvements to the experimental signal "Ineffective Volume".

VSA v12042025 (for TradingView)

VSA indicator (full version) (private version) with updates
https://boosty.to/dilbronx/posts/2ec76b11-e0ff-4b4c-8009-d7a8155091ad (you will receive a link to a private script)
VSA Volume indicator (free)
https://ru.tradingview.com/script/S1EH5eAU-dil-bronx-vsa-volume/
---
* about VSA indicator
https://boosty.to/dilbronx/posts/56c110eb-17b5-4903-98e9-be9b724e514a
---  
RELEASE NOTES:
VSA v12.04.2025
EN:
What’s new:
* The code has been migrated from Pine Script version 5 to Pine Script version 6
* Added "Springboard" signal (Wyckoff terminology). It is required to enable "Experimental Analysis" in the indicator settings.
* Removed analysis using Sebastian Manby's method.
* Short setups described in "The Complete Volume Spread Analysis System Explained-A Companion Guide to Trading in the Shadow of theSmart Money" https://www.tradeguider.com/customer/pdf/VSA_System_explained.pdf
Realized Short Setups:
SHORT SET UP 1: SOW 1:BC + SOW 104:Supply Coming In + SOW 198:No Demand
SHORT SET UP 2: SOW 26: Supply Coming In + SOW 48:Supply Coming In + SOW 145:No Demand
SHORT SET UP 5: SOW 22:End of Rising Market + SOW 10:UpThrust + SOW 145:No Demand
SHORT SET UP 6: SOW 89,1:BC + SOW 86:Failed Test + SOW 10:UT/ND
Пример Short Setup:
Пример Short Setup:

VSA v26012025 (for TradingView)

VSA indicator (full version) (private version) with updates
 https://boosty.to/dilbronx/posts/2ec76b11-e0ff-4b4c-8009-d7a8155091ad (you will receive a link to a private script)
VSA Volume indicator
https://ru.tradingview.com/script/S1EH5eAU-dil-bronx-vsa-volume/
---
* about VSA indicator
 https://boosty.to/dilbronx/posts/56c110eb-17b5-4903-98e9-be9b724e514a
---
RELEASE NOTES:
VSA v26.01.2025
26 January 2025
EN:
What’s new:
* 30102024. Signal added: "Volume2 > Volume1 at the same level, but the result is worse!"
* 31122024. New experimental signal - The Buyer's Range is drawn if the signal "Ineffective Breakout of the Level Down (version A.Purnov)" and "Ineffective Breakout of the Level Down (version D.Bronx)" was previously detected".
Fix:
* 08072024. Fine-tuning the SOW1 signal.
* 30102024. Fine-tuning the SOW89 Failed Test. The signal has become more accurate and now takes into account the presence of tests in the near background.
* 08112024. Fine-tuning the UT10 Up Thrust. Cancel signal if next bar had a higher maximum.
* 21122024. Fine-tuning the SOW26, SOW48 Supply Comming In. The confirming down bar should not be of higher volume with a close not lower than the Incoming Supply bar.

VSA v09032024 (for TradingView)

* about VSA indicator https://boosty.to/dilbronx/posts/56c110eb-17b5-4903-98e9-be9b724e514a
VSA indicator (full version) with updates
https://boosty.to/dilbronx/posts/2ec76b11-e0ff-4b4c-8009-d7a8155091ad
(you will receive a link to a private script)
VSA Volume indicator
https://ru.tradingview.com/script/S1EH5eAU-dil-bronx-vsa-volume/
VSA lite indicator (demo version, limited functionality)
https://ru.tradingview.com/script/L5qPFyvR-vsa-demo
---
RELEASE NOTES:
VSA v09032024
09 March 2024
EN:
What’s new:
* Downward expansion of the Accumulation range if ST or SP falls below the support line
* Upward expansion of the Accumulation range, if the price rises above the resistance line - a secondary resistance level is formed (Creek level)
* Upward expansion of the Distribution range if ST or UT rises above the resistance line
* Downward expansion of the Distribution range, if the price falls below the support line - a secondary support level is formed (Ice level)
* New signal - Creek level
* New signal - Ice level
* Some signal labels merged with the background when using a light background on the chart. For some colors, a color analogue has been selected for the case when a light background is used on the chart. The corresponding setting is included in the indicator settings block.
Fix:

MOEX:MOEX

Акции Мосбиржи (MOEX) нарисовали красивый трейд от Аккумуляции до Распределения..
Ну как минимум индикатор VSA нам так подсказывает:
Похоже кина не будет :)
Минимум 184.28 от 13.12.2023 не обновили, возобновление продаж в волне от 19.12.2023 плохое.
Что можно ожидать:
- завтра день вверх, поглощая [сегодняшние, уровень ~200 руб.] продажи. И далее вверх на перехай.
- или пара тройка дней медленного движения вниз на снижении объемов и формировании NoSupply. И все туда же вверх на перехай.

VSA v19112023 (for TradingView)

RELEASE NOTES:
VSA v19112023
19 November 2023
What’s new:
* Changed the color of the SOS, SOW confirmation indicator
* Changed the color of the SOW non-confirmation indicator
* Wyckoff method: displaying additional Secondary Tests and their analysis, marking bad Secondary Tests (with text "bad ST")
* Wyckoff method: trading ranges of expected accumulation or expected distribution after cancellation are not deleted, but are repainted gray
* Additions, clarifications and corrections in the signal description texts
Fix:
* Fix Spring signal acknowledgment and cancellation mechanism
* Displaying the signal "No selling pressure after TrapUpMove" - the mark was below the bar High, now it is below the bar Low
* Fixed display of several signals on one bar when the labels of some signals overlap each other
* Corrected description of SOW 104 in Russian in the VSA_lib_desc_ru library
* Clarified definition of LPS, LPSY signals
* Fix sales pressure confirmation after SOW 58
* Fix for broken signal "Tips from Tom Williams: No Demand (no Weakness in the background) + No Supply (confirmed) = Strength."
Subscription levels2

Standard

$1.36 per month
Includes:
- "Trend Clusters" (QUIK) indicator
- indicator updates
- and other materials
---
https://boosty.to/dilbronx/posts/f7cbd1b5-9f9c-462d-966d-6e1878040308

Premium

$41 per month
Includes:
- "VSA" indicator (Trading View and QUIK)
- updates
- "Standard" subscription materials
---
https://boosty.to/dilbronx/posts/2ec76b11-e0ff-4b4c-8009-d7a8155091ad
---
https://boosty.to/dilbronx/posts/2c822fb7-066c-42ca-9df4-5a625f752037
Go up