VSA Volume (for TradingView)

"VSA Volume" indicator for TradingView
EN:
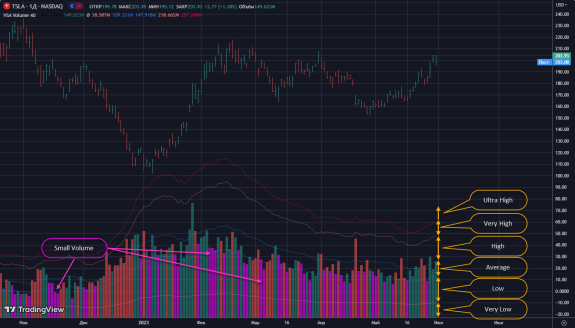
"VSA Volume" indicator - shows the volume category according to Volume Spread Analysis.
The source code of the indicator is completely original and written by me.
The idea was taken after studying the book by Tom Williams "Masters of the Markets" and book by Gavin Holmes "Trading In The Shadow of the Smart Money".
In the VSA methodology all analysis is based on relative volume.
This means that the exact values of the volume on the price bars are not nearly as important as their volume in relation to the previous volume bars.
The "VSA Volume" indicator is best used as an additional indicator in conjunction with other indicators.
VSA uses the following relative volume classifications:
* Ultra High
* Very High
* High
* Average
* Low
* Very Low
To use the indicator effectively, a trader needs to be familiar with the Volume Spread Analysis (VSA) methodology.
A red bar is for a down bar.
Green bar - for up bar.
A pink bar is for a bar with a volume that is less than the previous two.
---
RU:
Индикатор "VSA Volume" - показывает категорию объема в соответствии с методикой Volume Spread Analysis (VSA).
Исходный код индикатора полностью оригинальный и написан мной.
Идея взята после изучения книги Тома Вильямса "Хозяева Рынков" и книги Гэвина Холмса "Торговля в тени умных денег".
В методологии VSA весь анализ основан на относительном объеме.
Это означает, что точные значения объема на ценовых барах не так важны, как их объем по отношению к предыдущим объемным барам.
Индикатор "VSA Volume" лучше использовать как дополнительный совместно с другими индикаторами.
В VSA используются следующие классификации относительного объема:
* Ultra High
* Very High
* High
* Average
* Low
* Very Low
Бар красного цвета - для даун-бара.
Бар зеленого цвета - для ап-бара.
Бар розового цвета - для бара с объемом, который меньше двух предыдущих.
Чтобы эффективно воспользоваться индикатором, трейдеру необходимо владеть методикой Volume Spread Analysis (VSA).
Рекомендуется применение совместно с индикатором "VSA" https://boosty.to/dilbronx/posts/56c110eb-17b5-4903-98e9-be9b724e514a
Индикатор "VSA Volume" бесплатен и доступен:
* по приватной ссылке -